
The results of an updated search for cosmic neutrino sources using six years of data collected by the ANTARES neutrino telescope has been recently published. The most signal-like accumulation of events is located at equatorial coordinates RA=-46.8° and Dec=-64.9° and corresponds to a 2.2σ background fluctuation. In addition, upper limits on the flux normalization of an E-2 muon neutrino energy spectrum have been set for 50 pre-selected astrophysical objects.
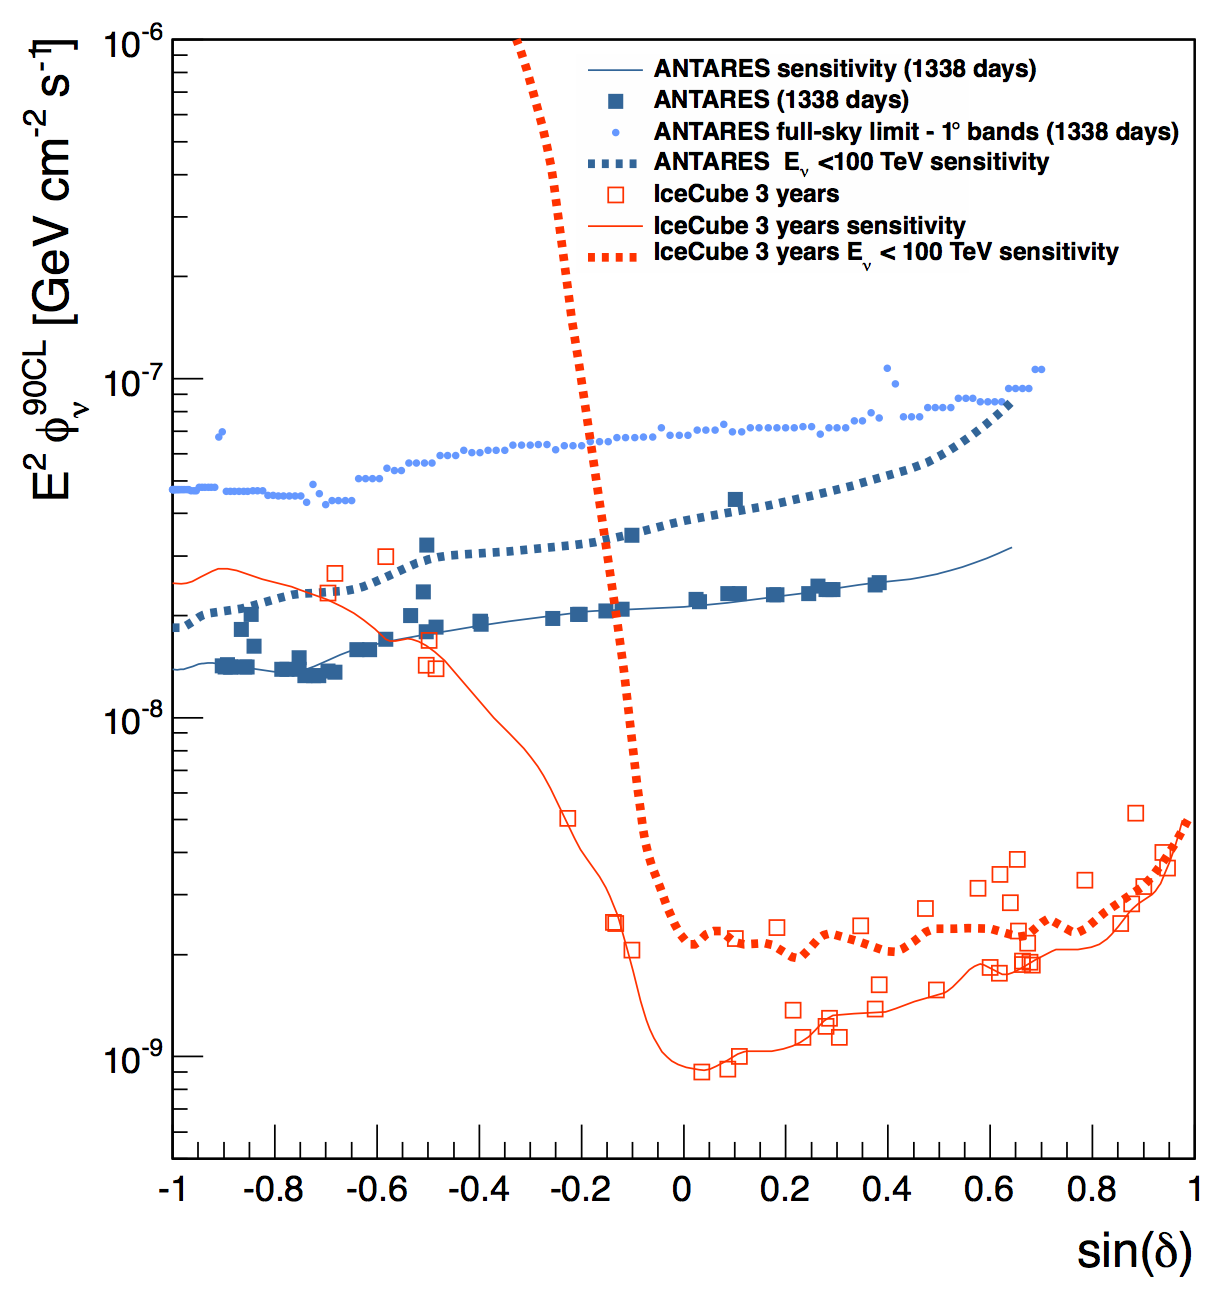
Finally, motivated by an accumulation of 7 events relatively close to the Galactic Centre in the recently reported neutrino sample of the IceCube telescope, a search for point sources in a broad region around this accumulation has been carried out. A point source close to the Galactic Centre has been recently proposed to explain this accumulation of events (see this publication) ; the absence of a significant neutrino signal detected by ANTARES in these directions has allowed us to exclude a single point source (width = 0°) as being the emitter of these events. Constraints on extended sources have also been set.


