
Line #2. |
La ligne N°2 |
| Detection of first muons with two linesLine 2 is the second Antares line out of 12. It is identical to the line 1 that has been taking data since March.
The two pictures below come from the Antares control room in La Seyne-sur-Mer (France). They present the detection of a muon track in line 1 (left) and line 2 (right), simultaneously. The figures present the altitude evolution (z in metres) of the light received as a function of the time (in ns). The curves have been obtained from a fit to the points in the pictures. They behave as hyperbolae as expected from the emission of Cherenkov light from a charged particle in water. This muon comes from the interaction of the primary cosmic rays in the atmosphere above the detector. This downward going muon component is a background for the experiment that can be rejected after identification. In this picture the black dots correspond to photons that triggered the reconstruction of the event. The red square indicates the photons that were used to reconstruct the muon. Most of the crosses come from the random optical background (below 100 kHz per optical module in these pictures). Click to enlarge. |
Premiers muons détectés avec les deux lignes La ligne 2 est la deuxième des 12 lignes d’Antares. Elle est identique à la ligne 1 qui détecte des muons depuis mars dernier.Les deux images ci-dessous ont été obtenues à la salle de contrôle de La Seyne-sur-Mer (France). Elles présentent la détection de la trace laissée par un muon sur la ligne 1 (à gauche) et la ligne 2 (à droite) simultanément.Les figures présentent l’évolution de l’altitude de la lumière reçue (en mètres) en fonction du temps mesuré (en nanosecondes). Les courbes sont issues d’un ajustement à partir des points dans la figure. Elles se comportent comme des hyperboles, ce qui est attendu de l’émission de lumière Tchérenkov par une trace chargée dans l’eau.Ce muon provient de l’interaction du rayonnement cosmique dans les hautes couches de l’atmosphère au-dessus du détecteur. Cette composante descendante est un bruit de fond pour l’expérience qui peut-être rejeté après identification.Dans ces figures, les ronds noirs correspondent à des photons qui ont déclenché l’identification. Les carrés rouges indiquent les photons qui ont été utilisés pour reconstruire le muon. La plupart des croix sont issues du bruit de fond optique sur le site (moins de 100 kHz par module optique). Cliquez pour agrandir. 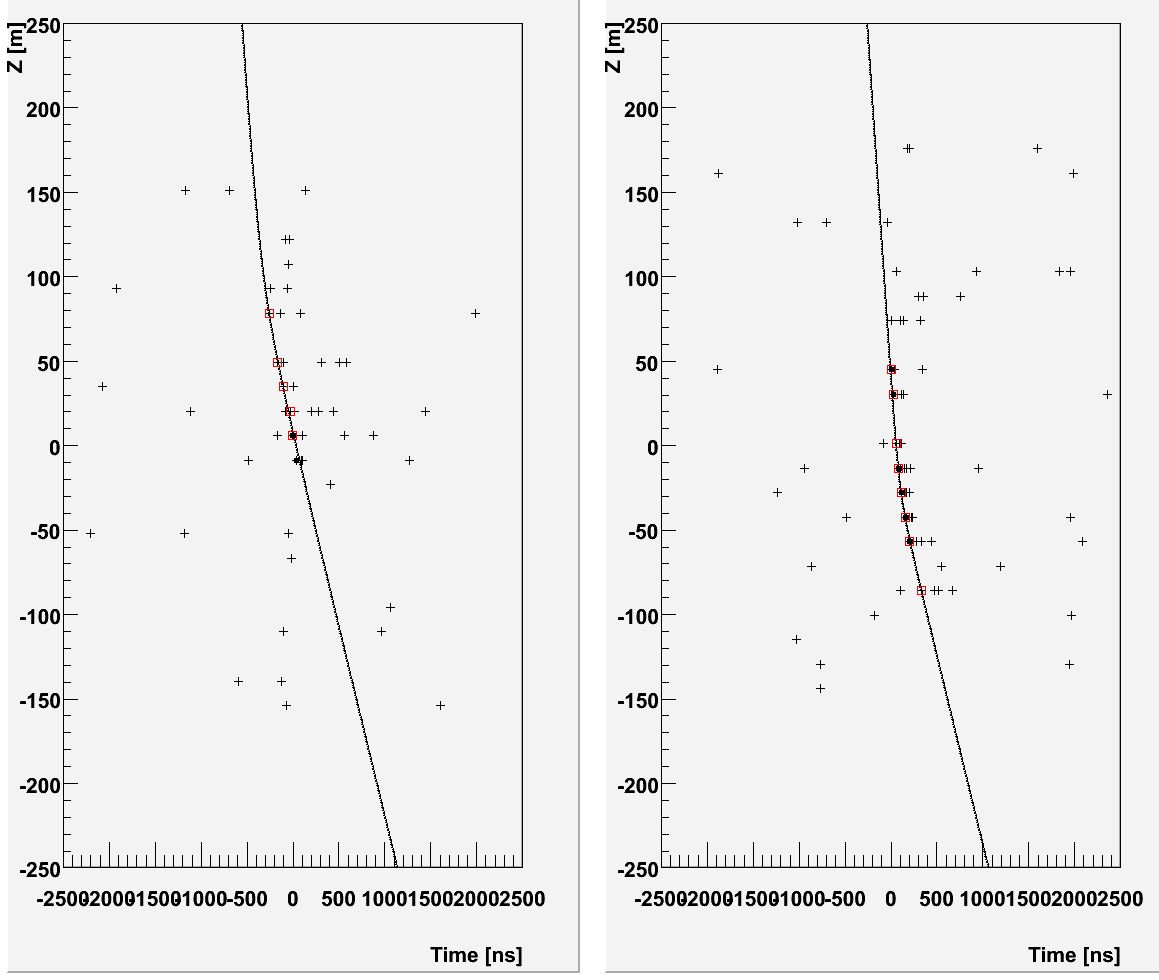 |
| Some counting rates (dominated by the random optical background) on some of the floors of the line 1 and 2 are shown on the two pictures below. The rates are between 60 and 80 kHz on both lines (click to enlarge). | Les images ci-dessous montrent les taux de comptage observés sur quelques étages des lignes 1 et 2. Les taux de comptage, dominés par le bruit de fond optique, sont de 60 à 80 kHz (cliquez pour agrandir). |
| Line 1 – Ligne 1 | Line 2 – Ligne 2 |
 |
 |
You may also like

EN Since 2007 ANTARES scrutinizes the sky in the search for neutrinos of a cosmic origin that could witness the most […]

The ANTARES Collaboration is deeply shocked by Russia’s attack on Ukraine and the horror it brings to the Ukrainian people. We stand […]
The ICECUBE collaboration has published the first solid evidence for cosmic neutrinos. The ANTARES Collaboration congratulates the IceCube Collaboration with this important […]

The 2017 Physics Nobel Prize has been attributed to Rainer Weiss, Barry C. Barish, and Kip S. Thorne for the observation of gravitational waves, […]